Fibonacci Retracement: How to Draw It and Which Levels Matter
Where a Fibonacci retracement starts and ends, what the 38.2, 50 and 61.8 percent levels tell you, and why no level is a reason to enter on its own.
November 10, 2026·2 min read·Vlevel team
 Strategy & backtesting
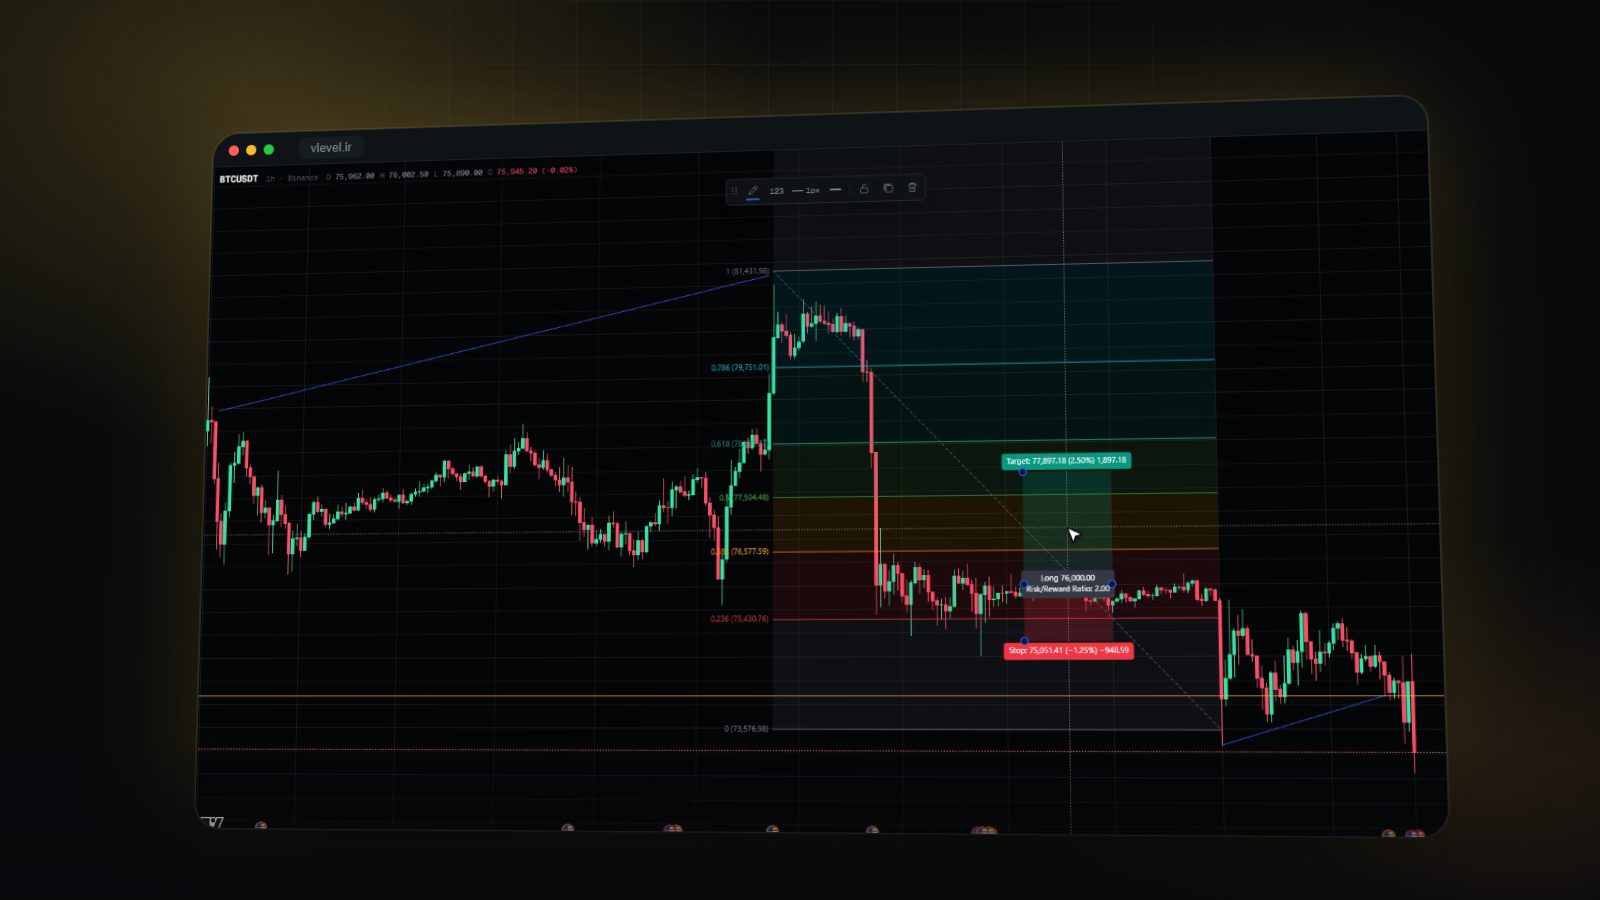
Price never moves in a straight line. After every leg up, part of it is given back, and then, if the trend is still alive, the move resumes. The trader's eternal question is: how far will the pullback go? The Fibonacci retracement tool answers that by marking a few likely levels on the chart.
Where the levels come from
In the Fibonacci sequence (1, 1, 2, 3, 5, 8, 13, 21…) each number is roughly 0.618 of the next and 0.382 of the one after. The tool's main levels come from these ratios: 23.6, 38.2, 61.8 and 78.6 percent. The 50 percent level isn't a Fibonacci ratio, but traders have always watched "half the move", so every tool includes it.
To be honest: there's no scientific reason for markets to "respect" these ratios. The levels work mostly because millions of people see them and place orders around them. Treat Fibonacci as a map of likely zones, not a forecast.
Drawing it right: low to high, or the other way
- Find a clear swing. In an uptrend, from a well-defined low to the high made after it. Points you're not sure the move started from give meaningless levels.
- In an uptrend, draw from the low to the high, so the levels sit below the high, where the pullback will go. In a downtrend, the reverse: high to low.
- Wicks or bodies? Most traders use the wicks (the highest and lowest prices). Whichever you choose, always use the same.
- Timeframe matters. A swing on the daily chart gives more important levels than one on a five-minute chart.
What each level usually says
- 23.6%: a shallow pullback, usually seen in very strong trends.
- 38.2%: the first serious zone; a healthy pullback in a good trend.
- 50 to 61.8%: the zone most traders wait for. Some call the 61.8 to 65 percent band the "golden pocket".
- 78.6%: a deep pullback; if price goes beyond it, the swing may well have been misread.
Confluence: where Fibonacci earns its keep
A Fibonacci level on its own is weak. But when the 61.8 percent level lands right on a previous support, a trend line or a round number, that zone has several reasons to react. That overlap is called confluence, and the best Fibonacci setups usually come from it.
Even in the best zone, entering just because price touched a line isn't enough. Wait for a sign of a turn: a reversal candle, a break of a small high on a lower timeframe, or a change in volume. The most logical stop sits a little beyond the next level or beyond the swing's low.
The bottom line
Fibonacci doesn't tell you where price will turn; it tells you where it's worth looking more closely. Pick the right swing, look for confluence, wait for confirmation and set your stop in advance. That turns Fibonacci from a magic ruler into a planning tool.
This article is for education only and is not a recommendation to buy or sell any asset. Trading financial markets, especially with leverage, carries high risk.
See the tools for yourself
A live chart with market depth, dozens of indicators and drawing tools, and a Lab that turns an idea into a backtested strategy.
More articles
 Strategy & backtesting
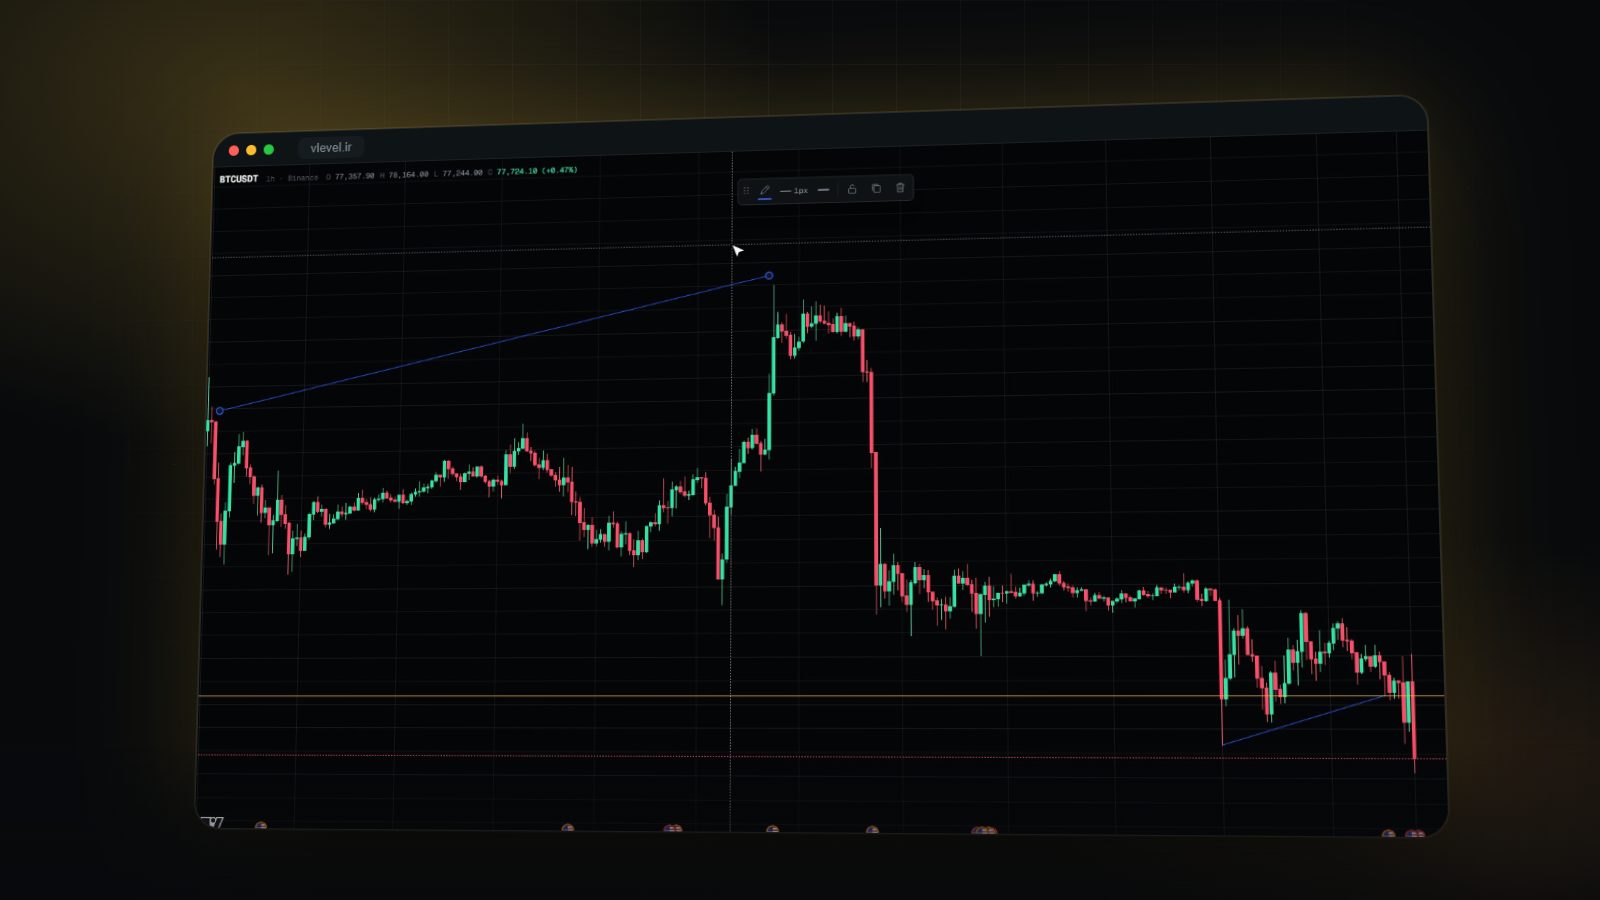
Trend Lines and Support & Resistance: Mistakes That Make Your Lines Worthless
How many touches a valid trend line needs, whether support and resistance are lines or zones, and what happens after a break. A practical guide to lines that actually help.
November 9, 2026 · 2 min read
 Strategy & backtesting
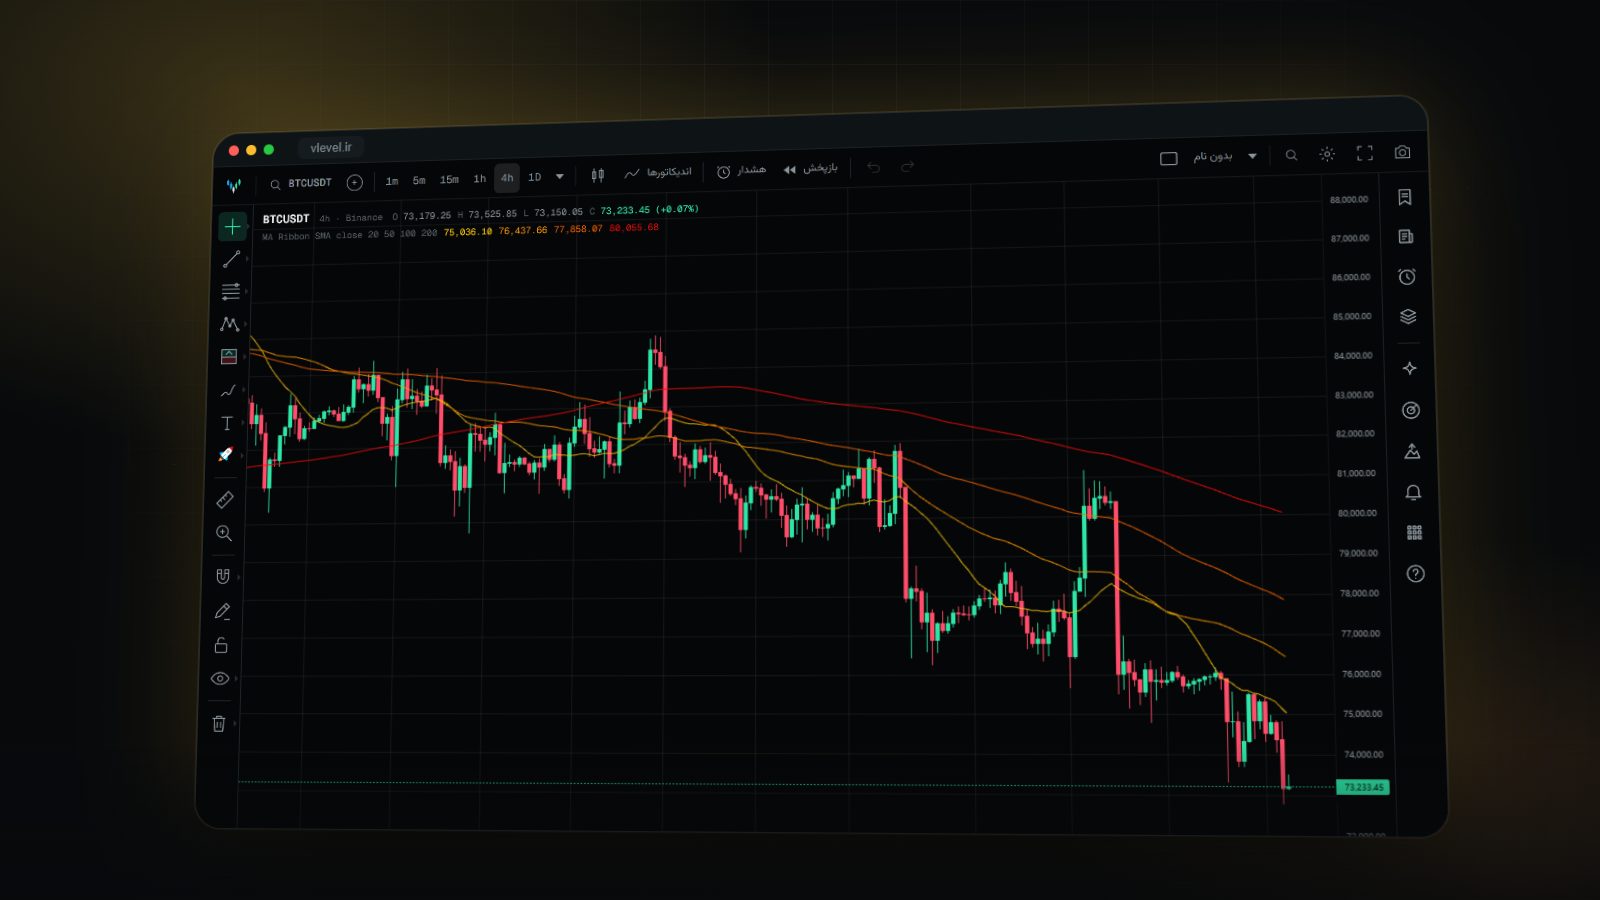
Multi-Timeframe Analysis: See the Trend From Above, the Entry From Below
Why a setup that looks perfect on the five-minute chart can be against the trend on the four-hour. The top-down method, timeframe ratios and common mistakes.
November 8, 2026 · 2 min read
 Strategy & backtesting
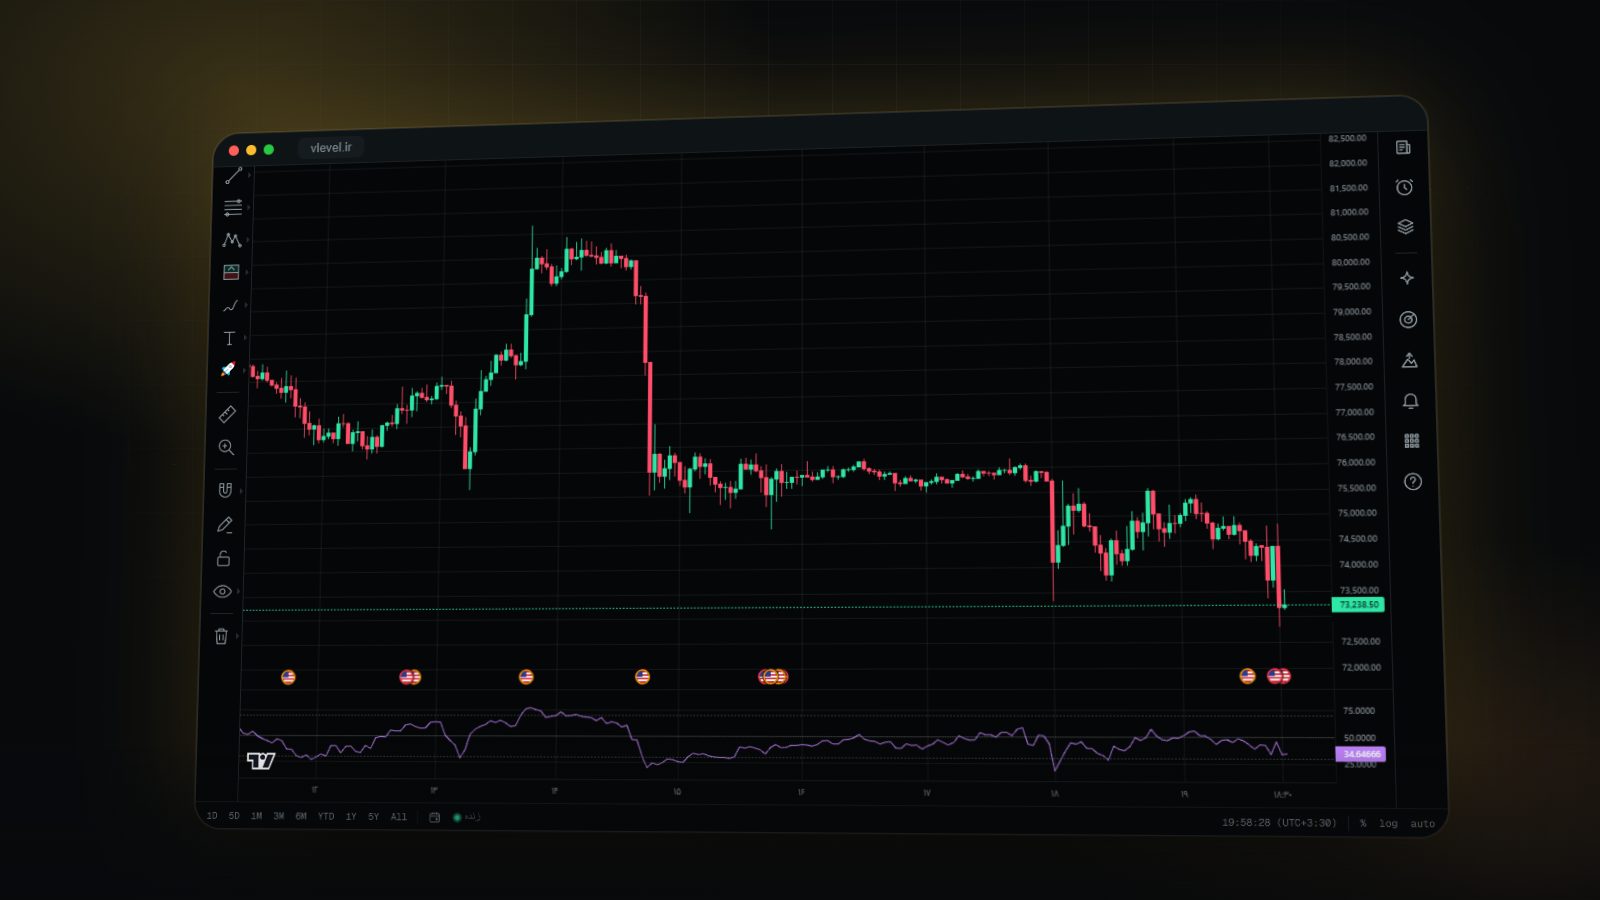
RSI Divergence: A Signal That Comes Early, but Isn't Always Right
What regular and hidden RSI divergences are, how to spot them on the chart, and why without confirmation and a stop, divergence can produce large losses.
November 7, 2026 · 2 min read