Trend Lines and Support & Resistance: Mistakes That Make Your Lines Worthless
How many touches a valid trend line needs, whether support and resistance are lines or zones, and what happens after a break. A practical guide to lines that actually help.
November 9, 2026·2 min read·Vlevel team
 Strategy & backtesting
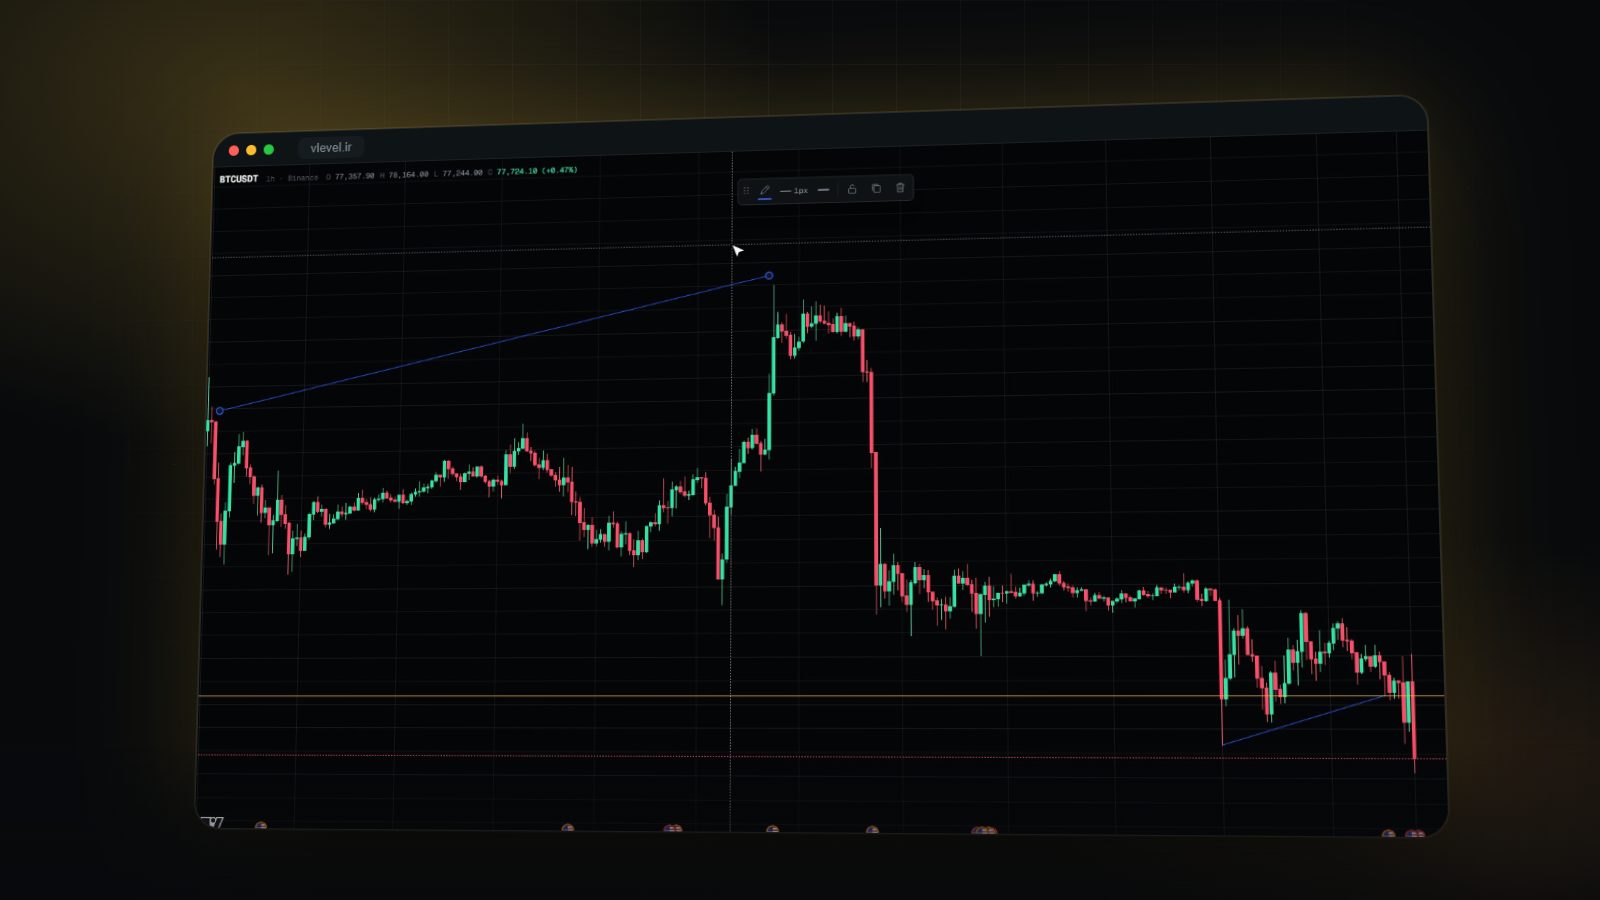
The trend line is the simplest tool in technical analysis, and perhaps for that reason the most abused. With a little carelessness you can draw any line on any chart and reach any conclusion. What separates analysis from wishful thinking is the rules you hold yourself to when drawing.
A valid trend line
- Two points make a line; three confirm it. Any two lows make a line; price reacting at a third touch shows others see it too.
- In an uptrend connect the lows; in a downtrend, the highs. A line that cuts through the middle of candles isn't a trend line.
- Slope matters. Very steep lines break quickly and mean little. Lines with a reasonable slope that have held for a long time are more reliable.
- Keep your rule fixed. If you draw from the wicks, always draw from the wicks. Nudging points until the line looks "nice" means you built it from your opinion, not from the market.
Support and resistance: a zone, not a price
Price rarely turns at exactly one number. Buyers' and sellers' orders are spread over a range, so treat support and resistance as zones with some thickness. Levels price has reacted to several times, daily and weekly highs and lows, and round numbers (such as 4,000 in gold or 100,000 in Bitcoin) are usually the most important.
Role reversal after a break
When strong resistance breaks, the same zone often acts as support later, and vice versa. The reason is simple: those who sold before the break and are now losing are glad to get out at breakeven when price returns. The break-and-retest pattern is built on exactly this behaviour.
Real break or fake-out?
Many breaks are false: price pokes through the line, runs the stops and comes back. A few signs help:
- A candle close beyond the line, not just a wick, on the timeframe you're analysing.
- Higher than usual volume on the break.
- Follow-through or a clean retest of the broken zone that holds.
A note on log scale
In very long trends where price has multiplied, such as Bitcoin over several years, a trend line on a normal scale differs from one on a logarithmic scale. For long-term analysis, log scale usually gives a truer picture of percentage moves.
The bottom line
A few valid lines beat a chart full of them. Keep only levels price has really reacted to, see support and resistance as zones, and wait for a candle close before trusting a break.
This article is for education only and is not a recommendation to buy or sell any asset. Trading financial markets, especially with leverage, carries high risk.
See the tools for yourself
A live chart with market depth, dozens of indicators and drawing tools, and a Lab that turns an idea into a backtested strategy.
More articles
 Strategy & backtesting
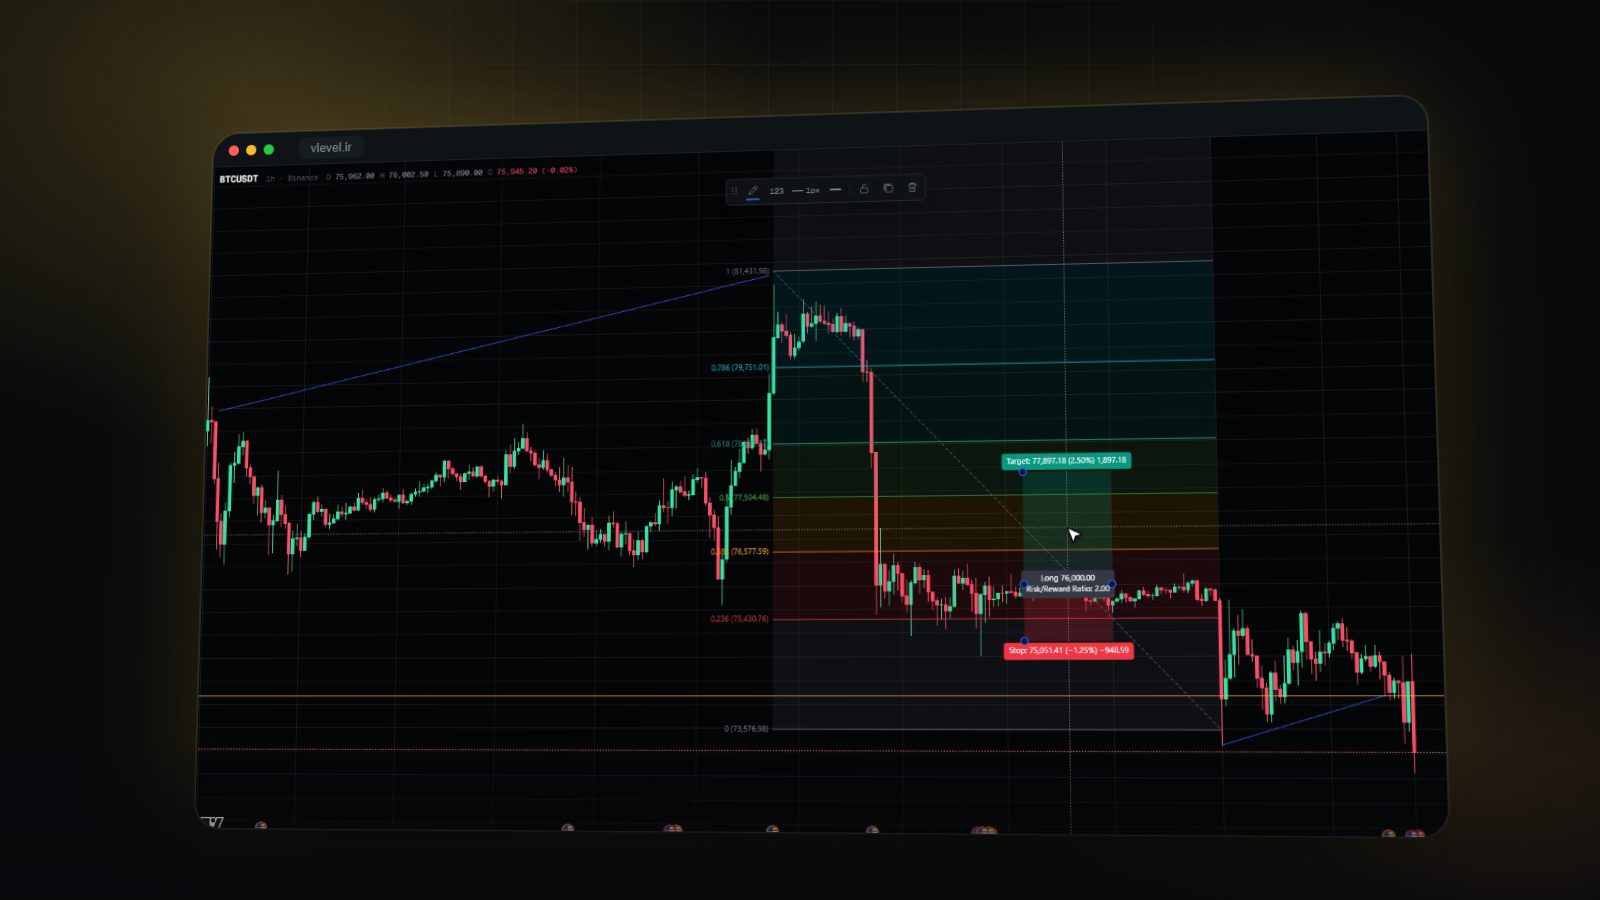
Fibonacci Retracement: How to Draw It and Which Levels Matter
Where a Fibonacci retracement starts and ends, what the 38.2, 50 and 61.8 percent levels tell you, and why no level is a reason to enter on its own.
November 10, 2026 · 2 min read
 Strategy & backtesting
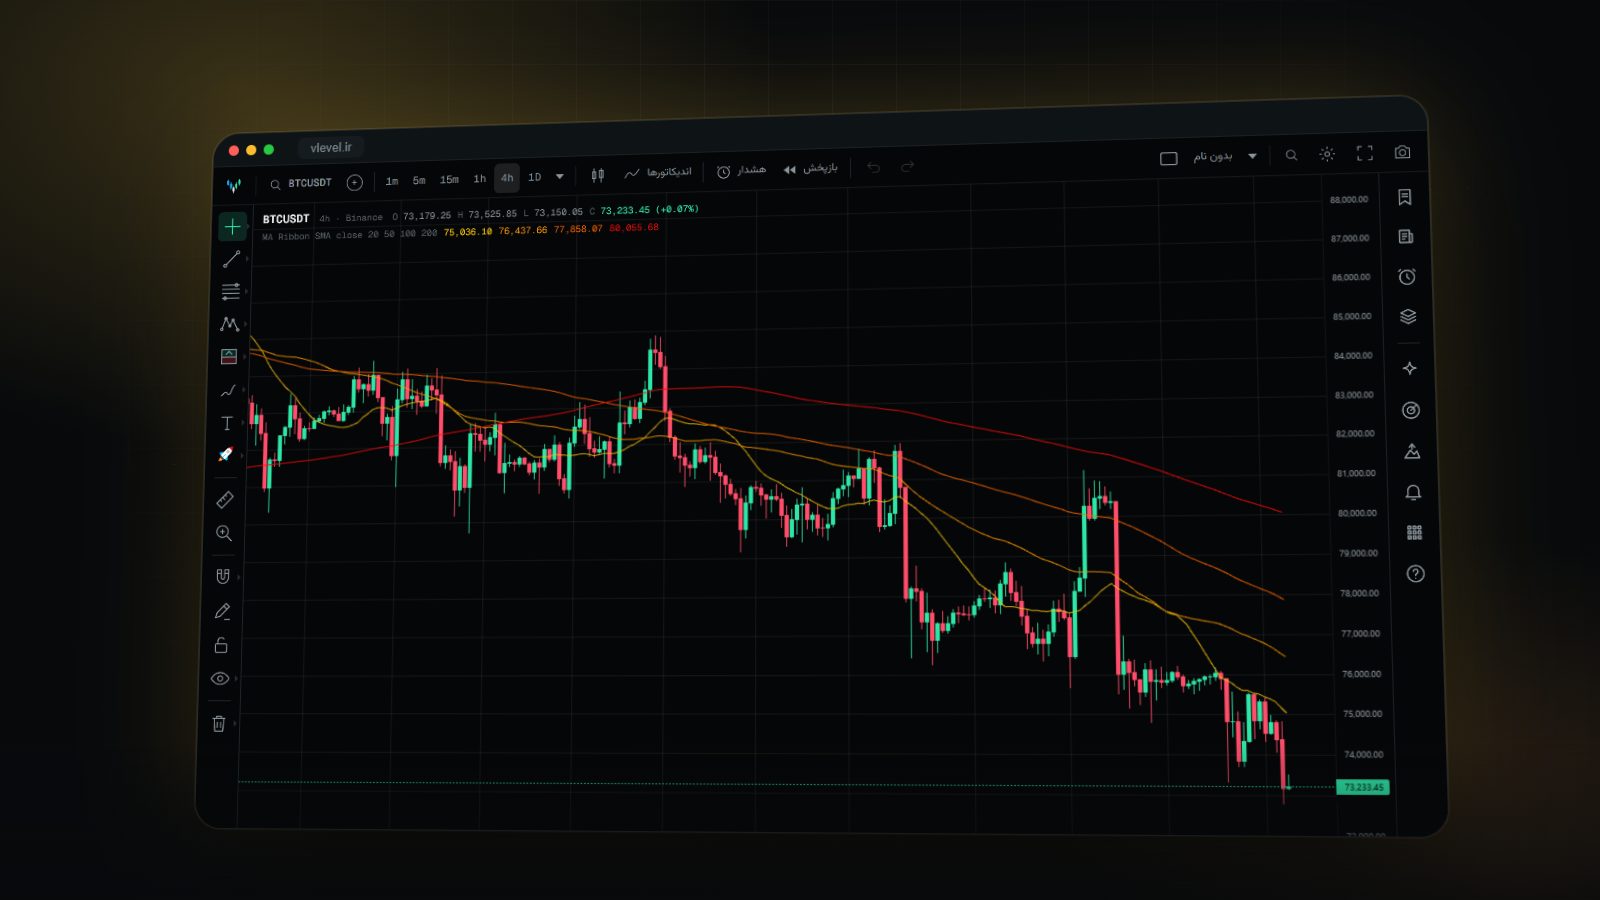
Multi-Timeframe Analysis: See the Trend From Above, the Entry From Below
Why a setup that looks perfect on the five-minute chart can be against the trend on the four-hour. The top-down method, timeframe ratios and common mistakes.
November 8, 2026 · 2 min read
 Strategy & backtesting
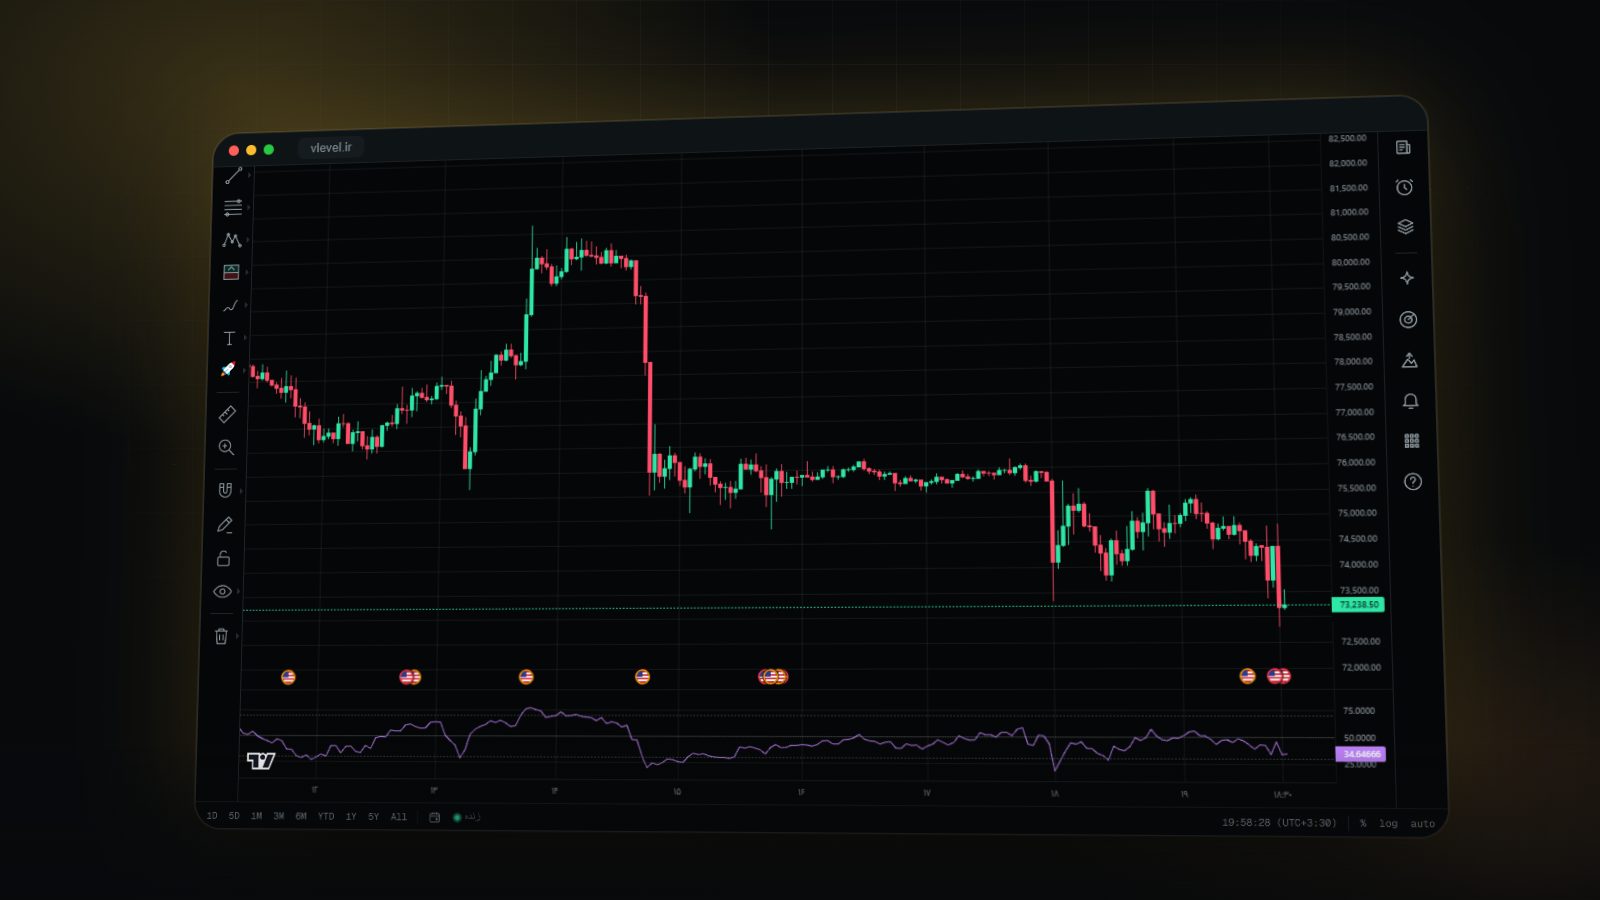
RSI Divergence: A Signal That Comes Early, but Isn't Always Right
What regular and hidden RSI divergences are, how to spot them on the chart, and why without confirmation and a stop, divergence can produce large losses.
November 7, 2026 · 2 min read