Multi-Timeframe Analysis: See the Trend From Above, the Entry From Below
Why a setup that looks perfect on the five-minute chart can be against the trend on the four-hour. The top-down method, timeframe ratios and common mistakes.
November 8, 2026·2 min read·Vlevel team
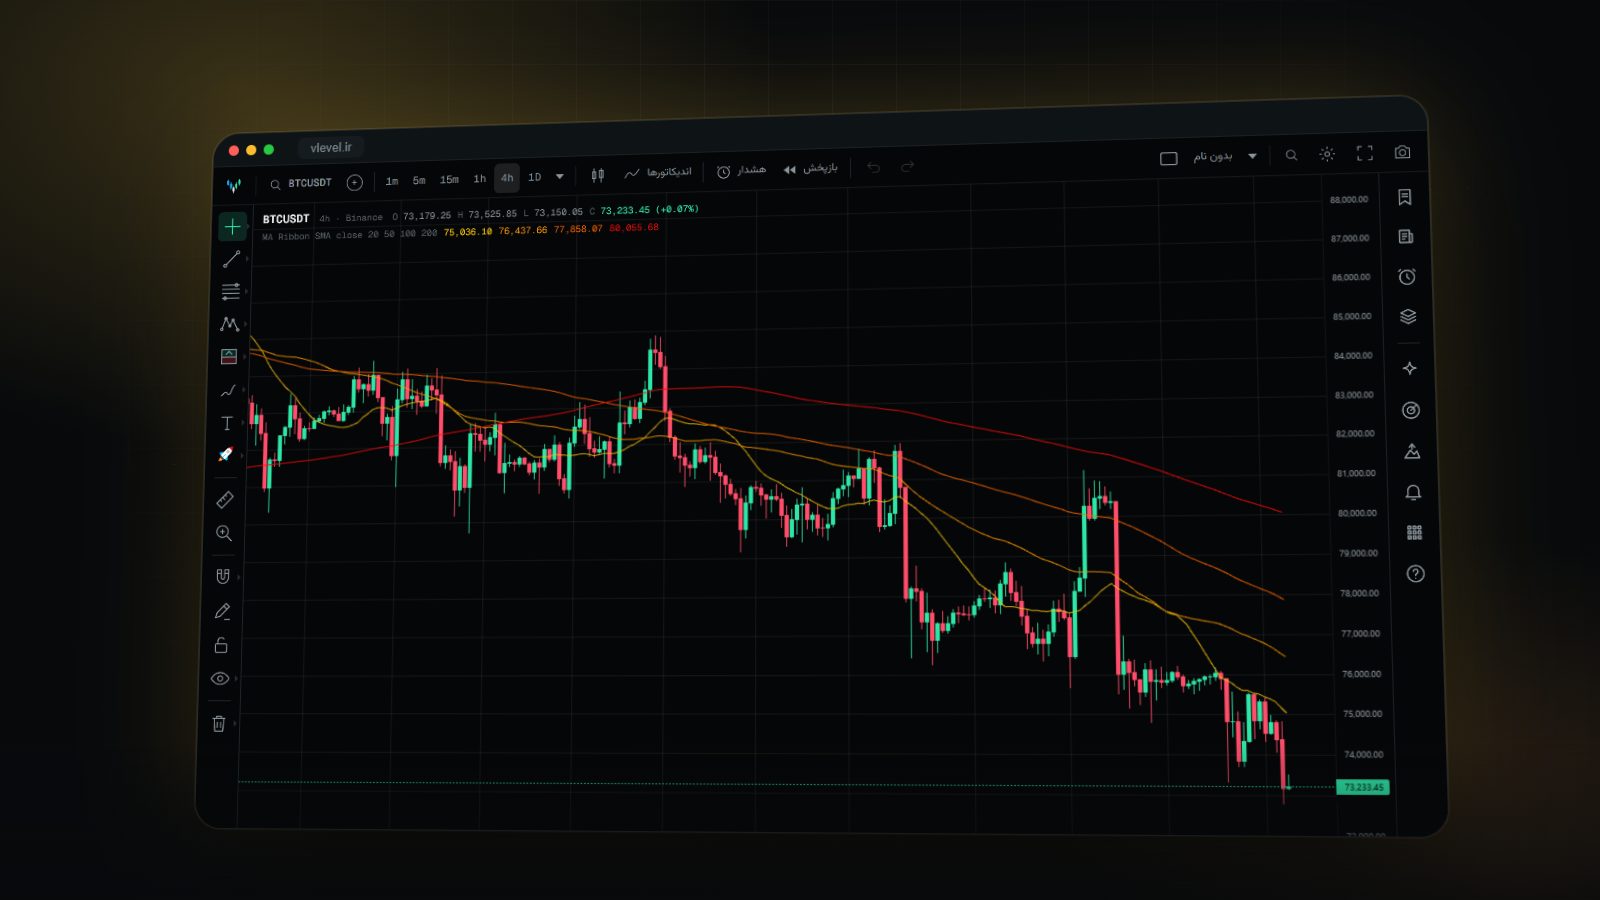 Strategy & backtesting
A daily candle is made of 24 one-hour candles, and each of those of 12 five-minute candles. Timeframes aren't three separate pictures; they're one market at three zoom levels. A trader who watches only one timeframe is like someone reading a map with a magnifying glass: they see the detail but not which city they're in.
The top-down method
The core idea is simple: the higher timeframe sets the direction, the lower one the timing. Alexander Elder described this as the "triple screen" and suggested each timeframe be about four to six times the next.
- Higher timeframe (say daily or 4-hour): the overall trend and the key levels. Here you decide to look only for longs, only shorts, or to stay out.
- Middle timeframe (say 1-hour): the setup. You wait for a pullback in the higher trend's direction, a test of support or resistance, or your strategy's pattern.
- Lower timeframe (say 15- or 5-minute): the trigger. A precise entry with a tighter stop and a better risk/reward.
Common combinations
- Swing trading: weekly, daily, 4-hour.
- Day trading: 4-hour, 1-hour, 15-minute.
- Scalping: 1-hour, 15-minute, 1-minute.
Common mistakes
- Timeframes too close together: 5 and 10 minutes show almost the same thing and add no information.
- Switching timeframes until a setup appears: if there's nothing on the 1-hour and you keep going lower until you see something, you're inventing a reason to trade, not finding one.
- Fighting the higher timeframe: shorting on the 5-minute right above major daily support is usually the worst possible spot.
- Conflict without a rule: when timeframes disagree, know in advance what you'll do. The simplest rule: don't trade.
Backtest across timeframes too
A strategy can be profitable on the 1-hour and, with the same rules, lose on the 15-minute because of noise and trading costs. Before settling on a timeframe, test the same rules on several and see whether the result holds or was just lucky on one.
The bottom line
Before every trade ask one question: what does this setup look like on the higher timeframe? If the answer is "against the trend and under major resistance", even the best five-minute setup isn't worth the risk.
This article is for education only and is not a recommendation to buy or sell any asset. Trading financial markets, especially with leverage, carries high risk.
See the tools for yourself
A live chart with market depth, dozens of indicators and drawing tools, and a Lab that turns an idea into a backtested strategy.
More articles
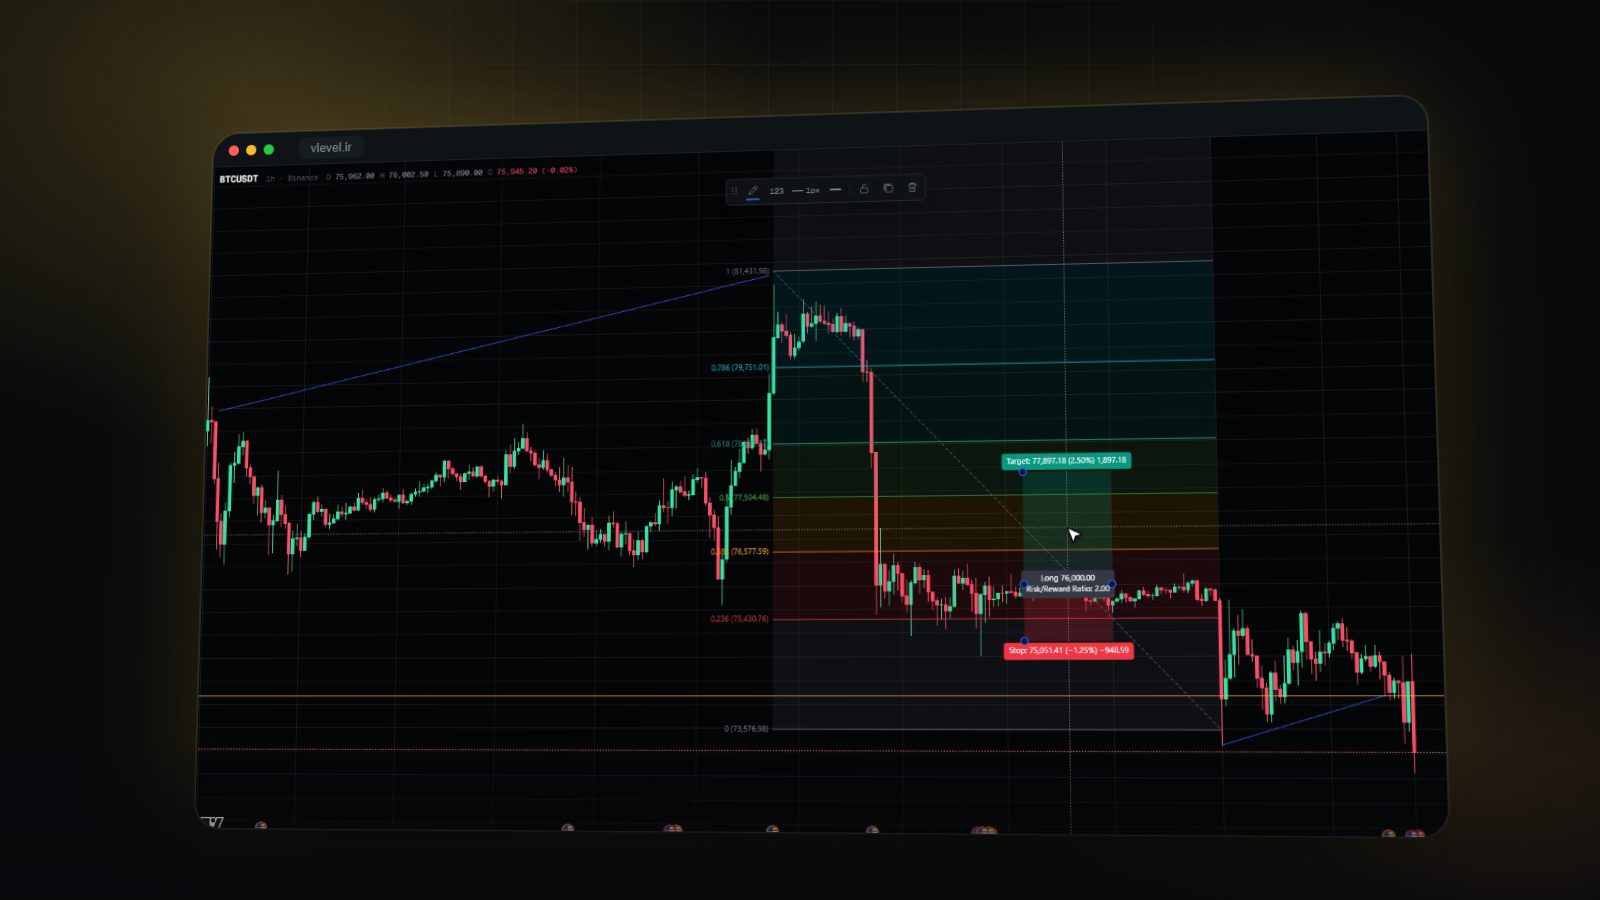 Strategy & backtesting
Fibonacci Retracement: How to Draw It and Which Levels Matter
Where a Fibonacci retracement starts and ends, what the 38.2, 50 and 61.8 percent levels tell you, and why no level is a reason to enter on its own.
November 10, 2026 · 2 min read
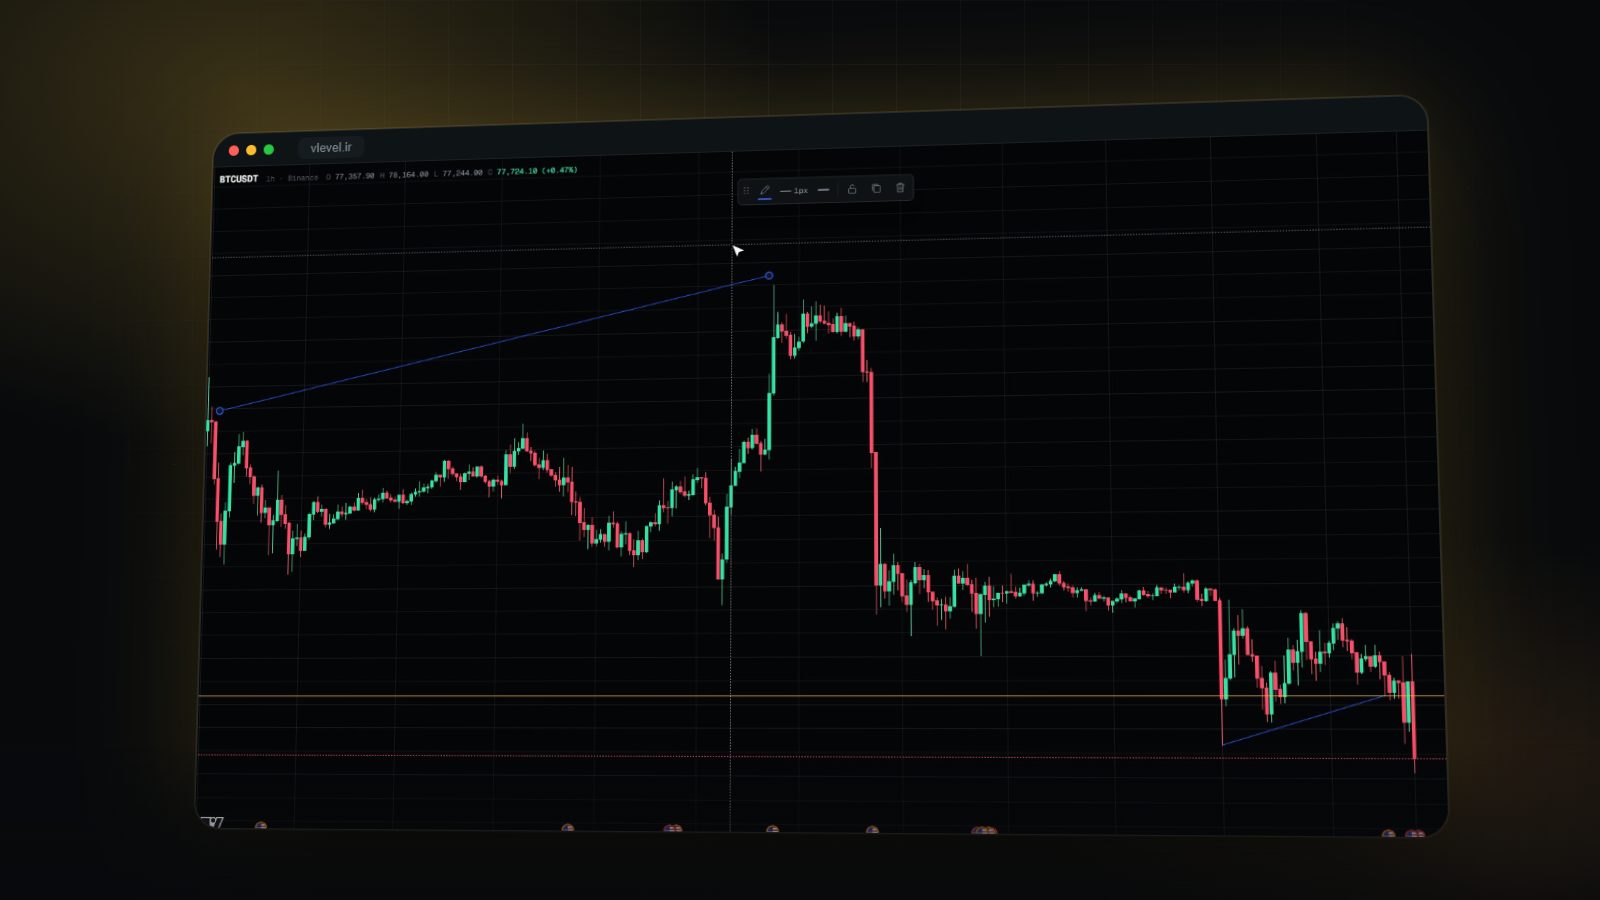 Strategy & backtesting
Trend Lines and Support & Resistance: Mistakes That Make Your Lines Worthless
How many touches a valid trend line needs, whether support and resistance are lines or zones, and what happens after a break. A practical guide to lines that actually help.
November 9, 2026 · 2 min read
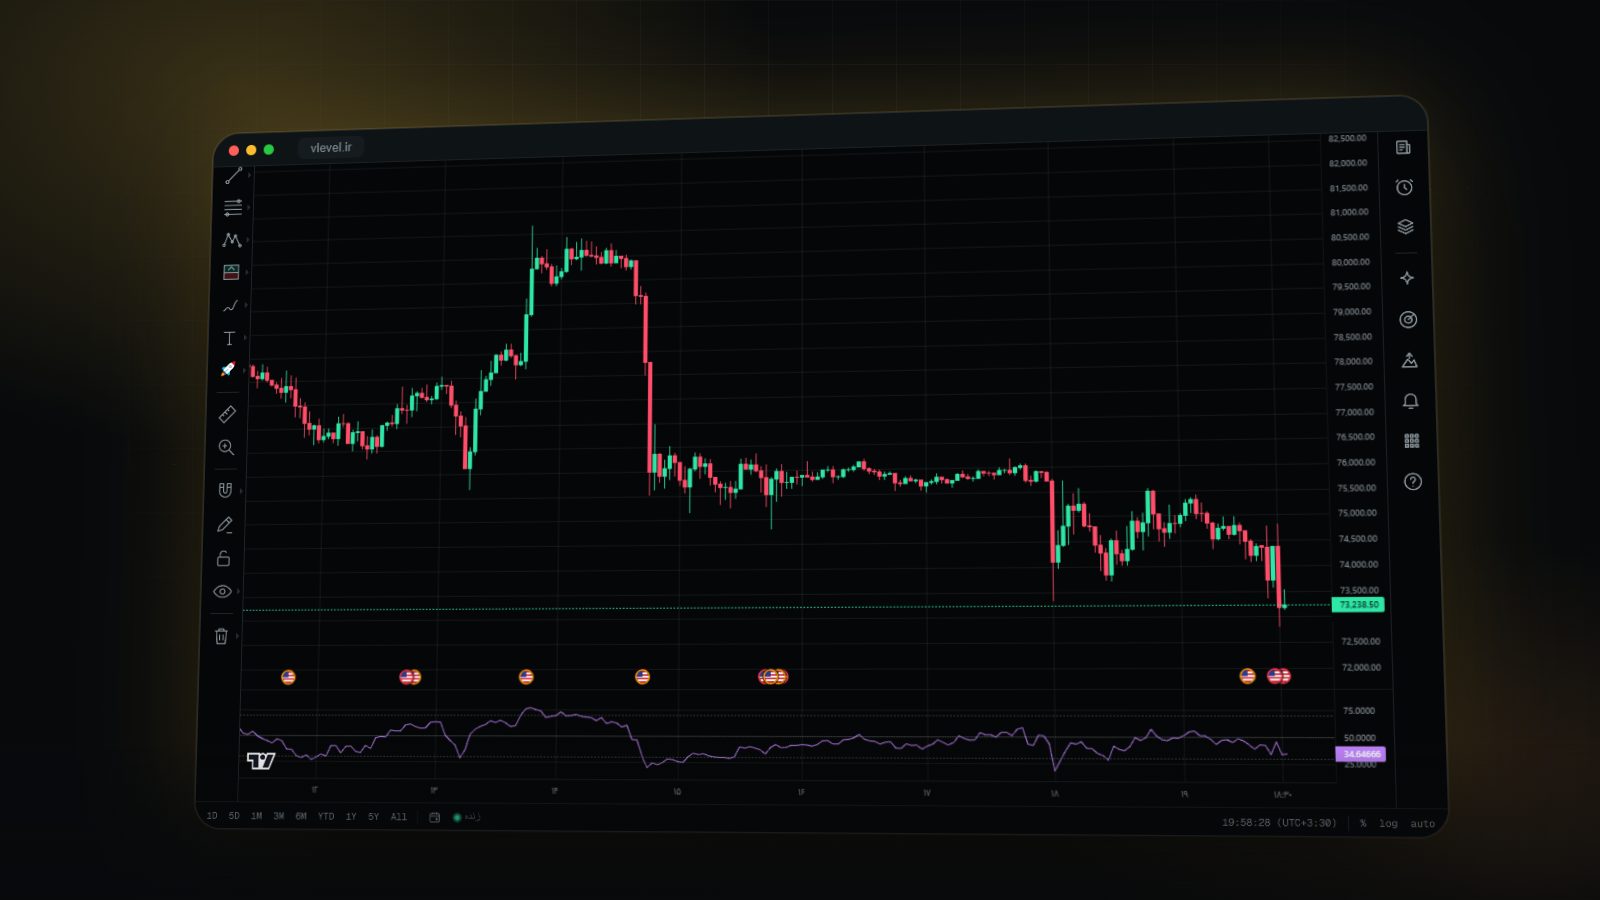 Strategy & backtesting
RSI Divergence: A Signal That Comes Early, but Isn't Always Right
What regular and hidden RSI divergences are, how to spot them on the chart, and why without confirmation and a stop, divergence can produce large losses.
November 7, 2026 · 2 min read