RSI Divergence: A Signal That Comes Early, but Isn't Always Right
What regular and hidden RSI divergences are, how to spot them on the chart, and why without confirmation and a stop, divergence can produce large losses.
November 7, 2026·2 min read·Vlevel team
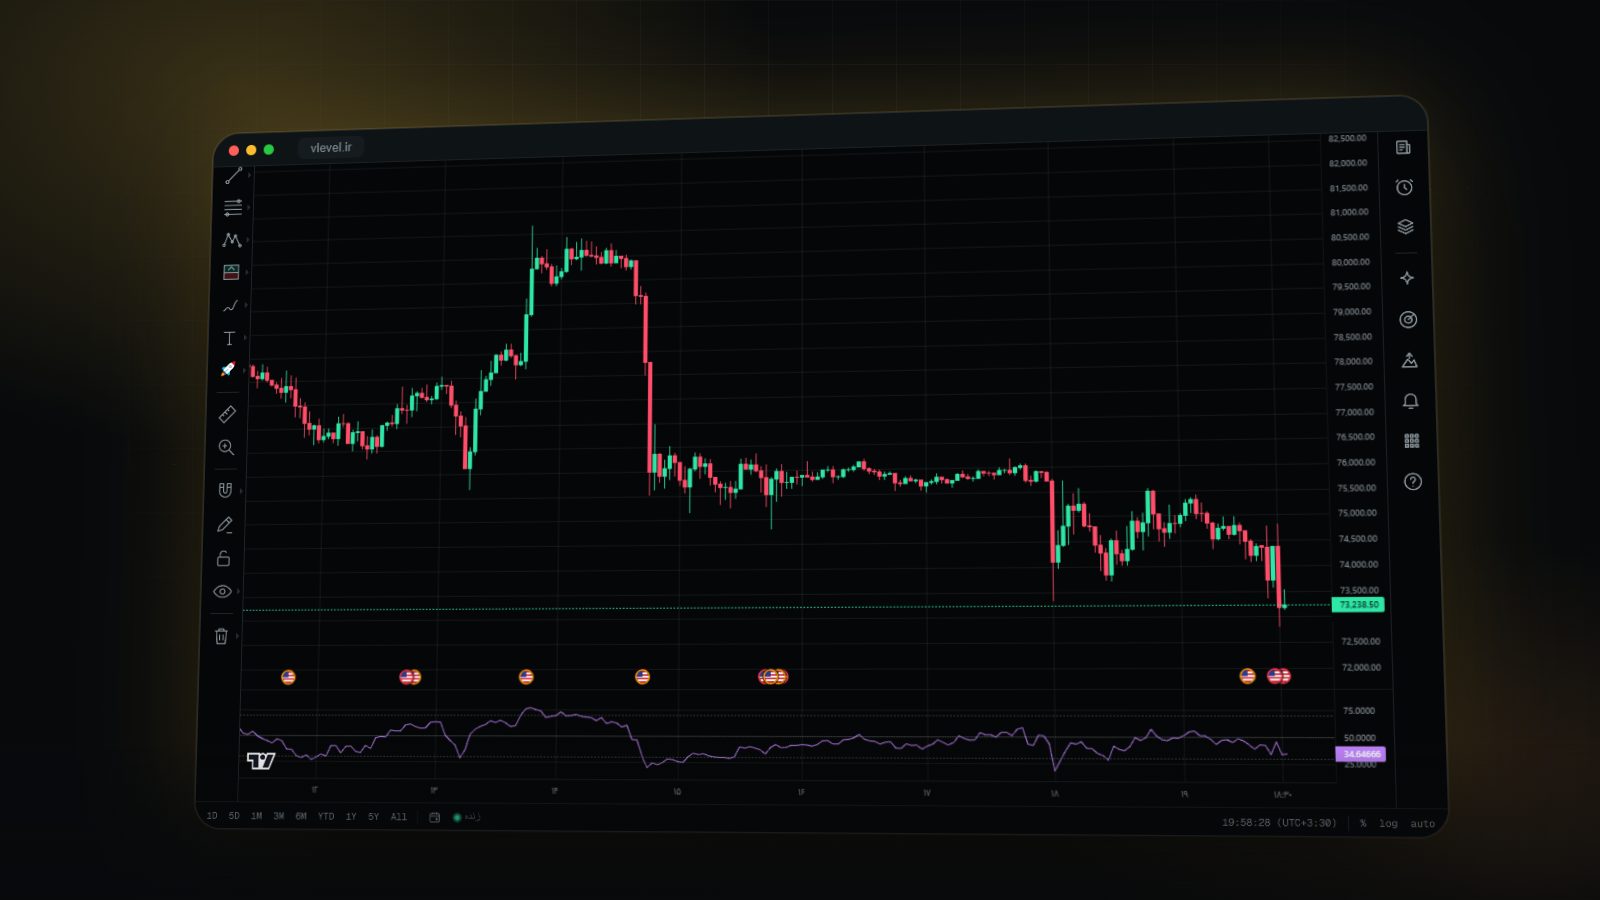 Strategy & backtesting
The Relative Strength Index, introduced by J. Welles Wilder in 1978, is still one of the most widely used indicators. RSI shows the speed and size of recent moves on a 0 to 100 scale, usually over 14 periods. Most beginners use it only as "sell above 70, buy below 30", which fails again and again in strong trends. RSI's more interesting use is divergence.
What divergence means
Divergence is when price and RSI tell different stories. Price makes a higher high but RSI a lower high: the new move happened with less force. That can be a sign of a tiring trend, but it isn't a reversal in itself.
Four kinds of divergence
- Regular bearish: price higher high, RSI lower high. A warning that an uptrend is weakening.
- Regular bullish: price lower low, RSI higher low. A warning that a downtrend is weakening.
- Hidden bullish: price higher low, RSI lower low. Usually seen in pullbacks within an uptrend, and a sign the trend will continue.
- Hidden bearish: price lower high, RSI higher high. A sign the downtrend will continue.
Why divergence fools people
In a strong trend, RSI can show divergence several times in a row while price keeps going. Anyone who traded against the trend on the first divergence takes loss after loss. Divergence says "momentum has slowed", not "it turns now". The timing has to come from somewhere else.
A disciplined way to use it
- Measure divergence on clear highs and lows, not on every wiggle. The two price points should pair with two RSI points on the same candles or very close to them.
- Look at where it happens: divergence at major support or resistance on a higher timeframe is worth far more than in the middle of the chart.
- Wait for confirmation: a break of the last minor low (for a short) or last minor high (for a long), or RSI crossing back through 50.
- Put the stop beyond the divergence high or low and size the position from that distance.
RSI ranges in trends
Andrew Cardwell showed that in uptrends RSI tends to swing between about 40 and 80, and in downtrends between about 20 and 60. So RSI above 70 in a strong uptrend isn't necessarily "overbought"; it may simply show the trend's strength.
The bottom line
RSI divergence is a good tool for knowing when to pay closer attention, not a standalone entry signal. Use it in the right place, with confirmation and a defined stop, and backtest whether it really has an edge on your symbol and timeframe.
This article is for education only and is not a recommendation to buy or sell any asset. Trading financial markets, especially with leverage, carries high risk.
See the tools for yourself
A live chart with market depth, dozens of indicators and drawing tools, and a Lab that turns an idea into a backtested strategy.
More articles
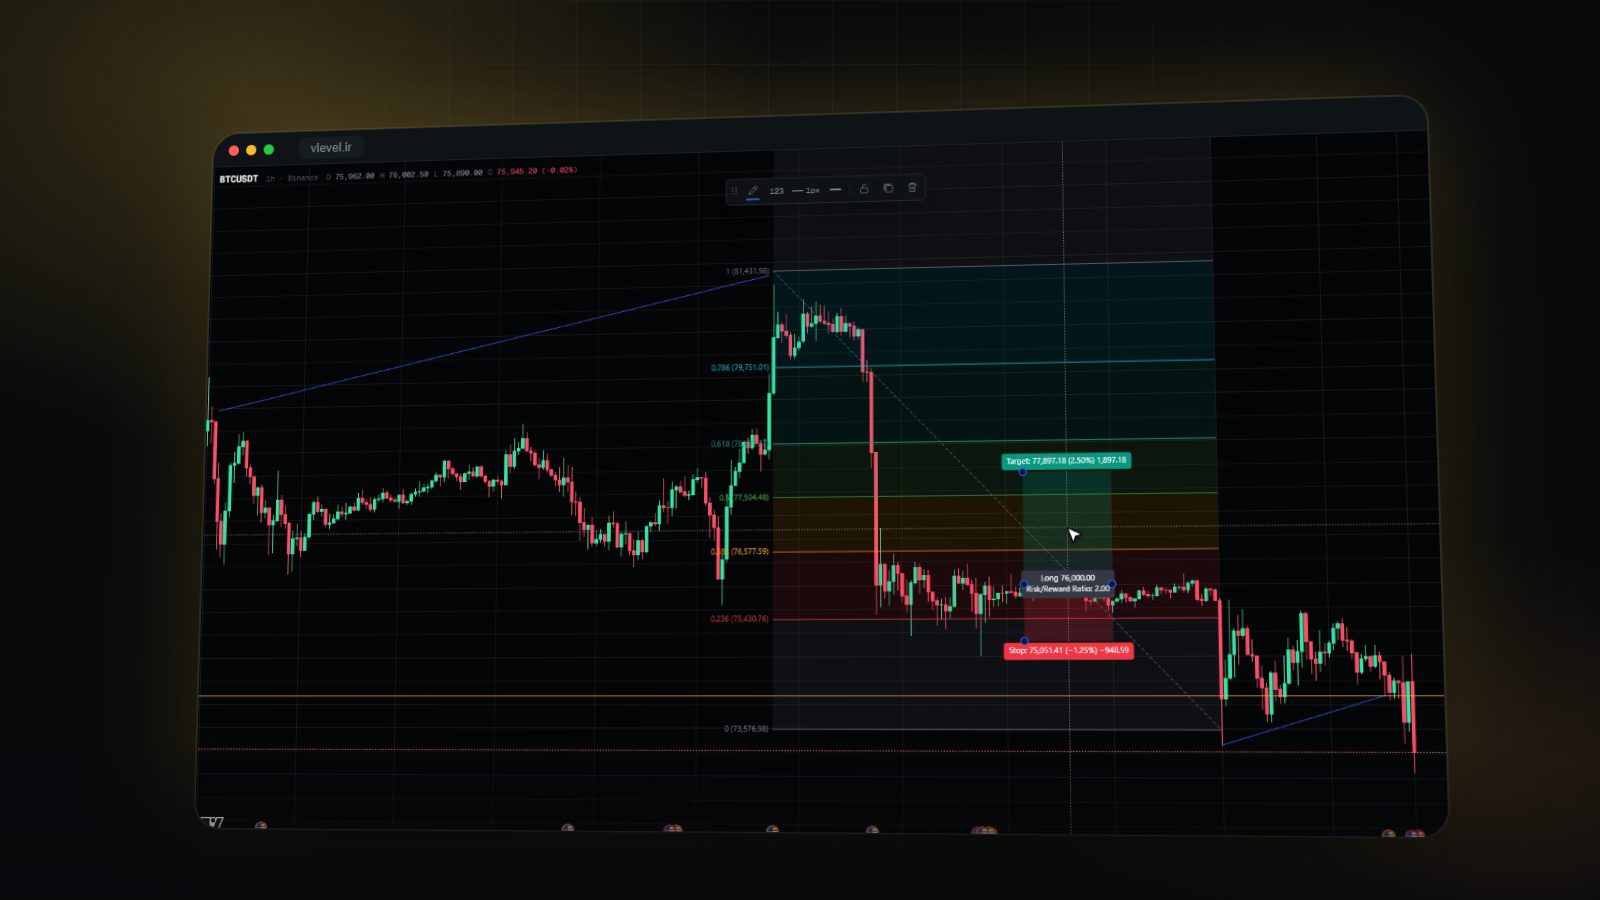 Strategy & backtesting
Fibonacci Retracement: How to Draw It and Which Levels Matter
Where a Fibonacci retracement starts and ends, what the 38.2, 50 and 61.8 percent levels tell you, and why no level is a reason to enter on its own.
November 10, 2026 · 2 min read
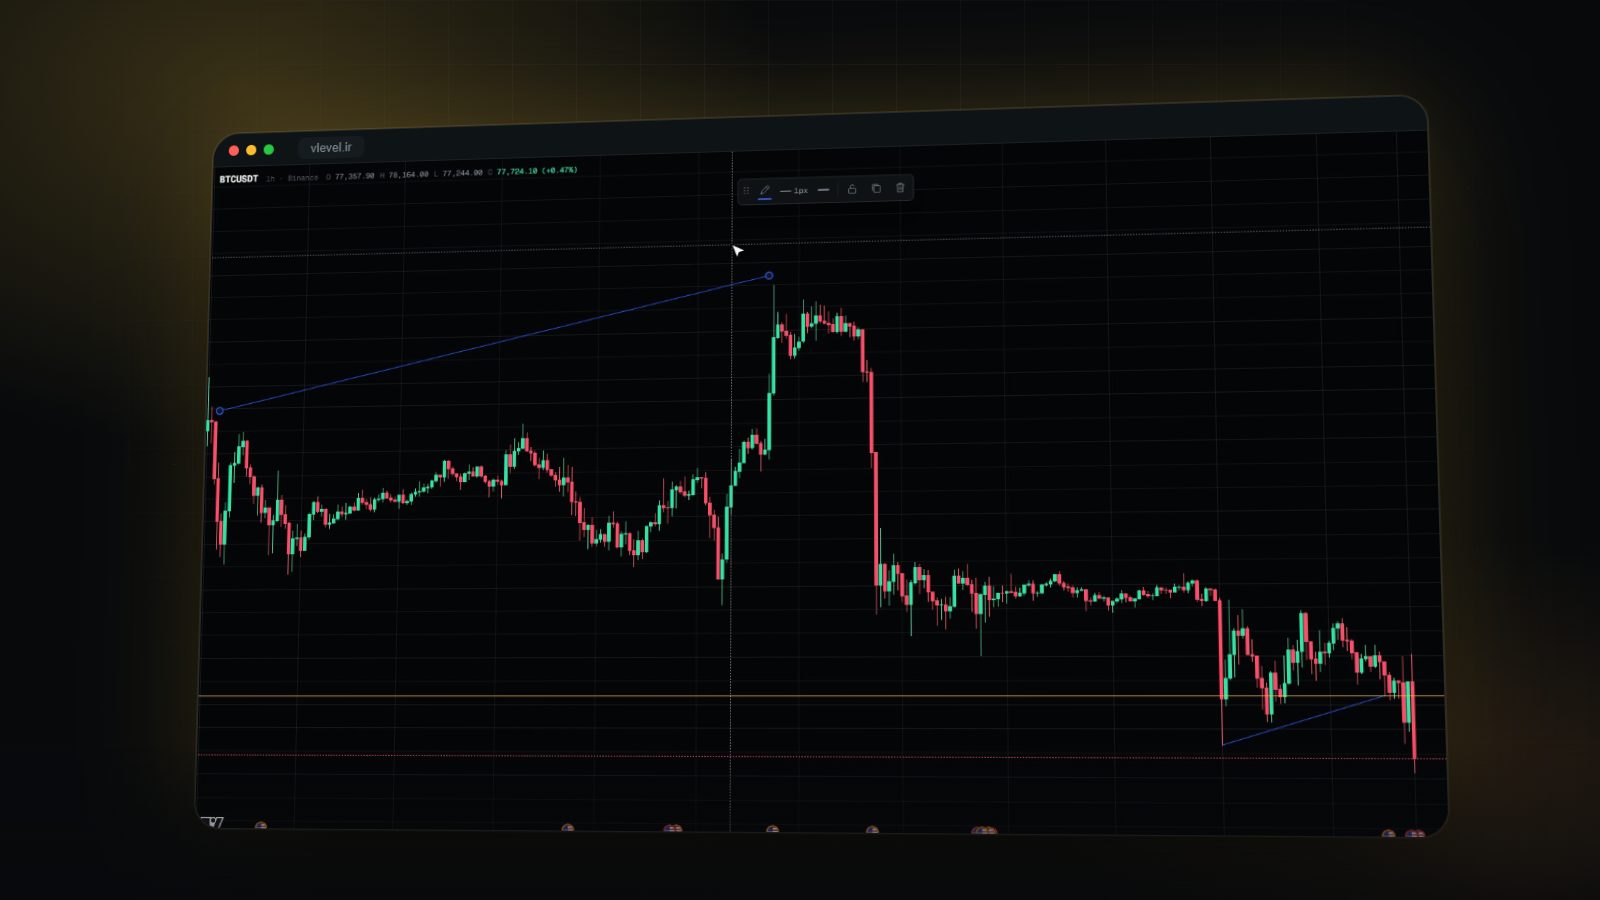 Strategy & backtesting
Trend Lines and Support & Resistance: Mistakes That Make Your Lines Worthless
How many touches a valid trend line needs, whether support and resistance are lines or zones, and what happens after a break. A practical guide to lines that actually help.
November 9, 2026 · 2 min read
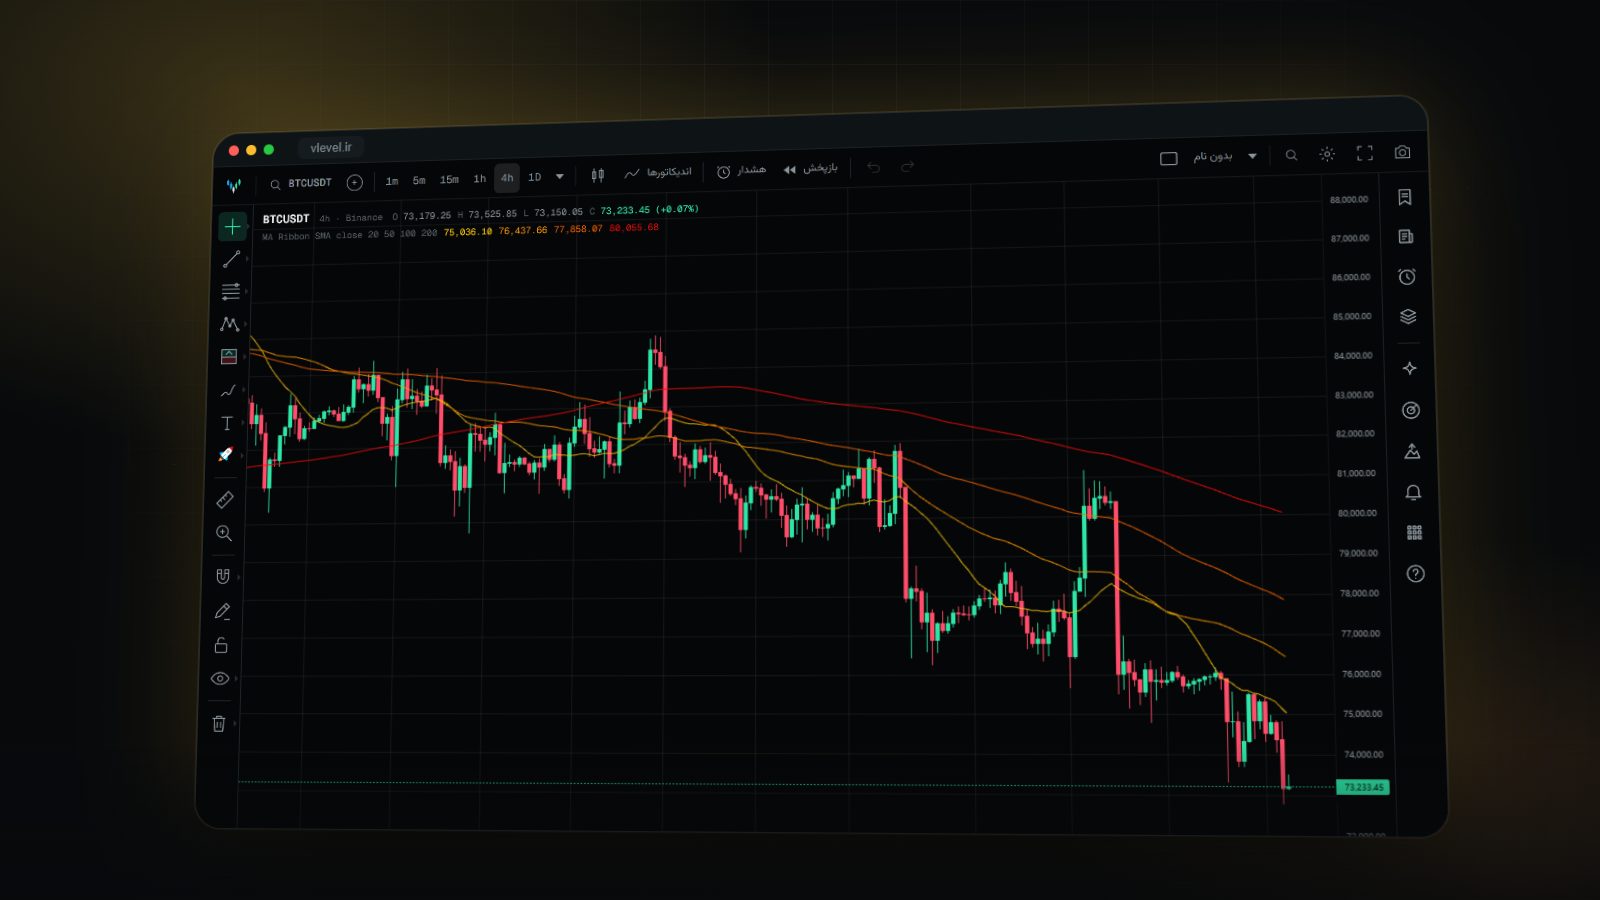 Strategy & backtesting
Multi-Timeframe Analysis: See the Trend From Above, the Entry From Below
Why a setup that looks perfect on the five-minute chart can be against the trend on the four-hour. The top-down method, timeframe ratios and common mistakes.
November 8, 2026 · 2 min read