Confirmation Entries and Sticking to Your Strategy: The Edge Built in Execution
A confirmation means waiting for the market to agree with you before entering: a closed candle, a retest, the higher timeframe in line. But even the best confirmation is worthless without sticking to your rules.
November 6, 2026·3 min read·Vlevel team
 Strategy & backtesting
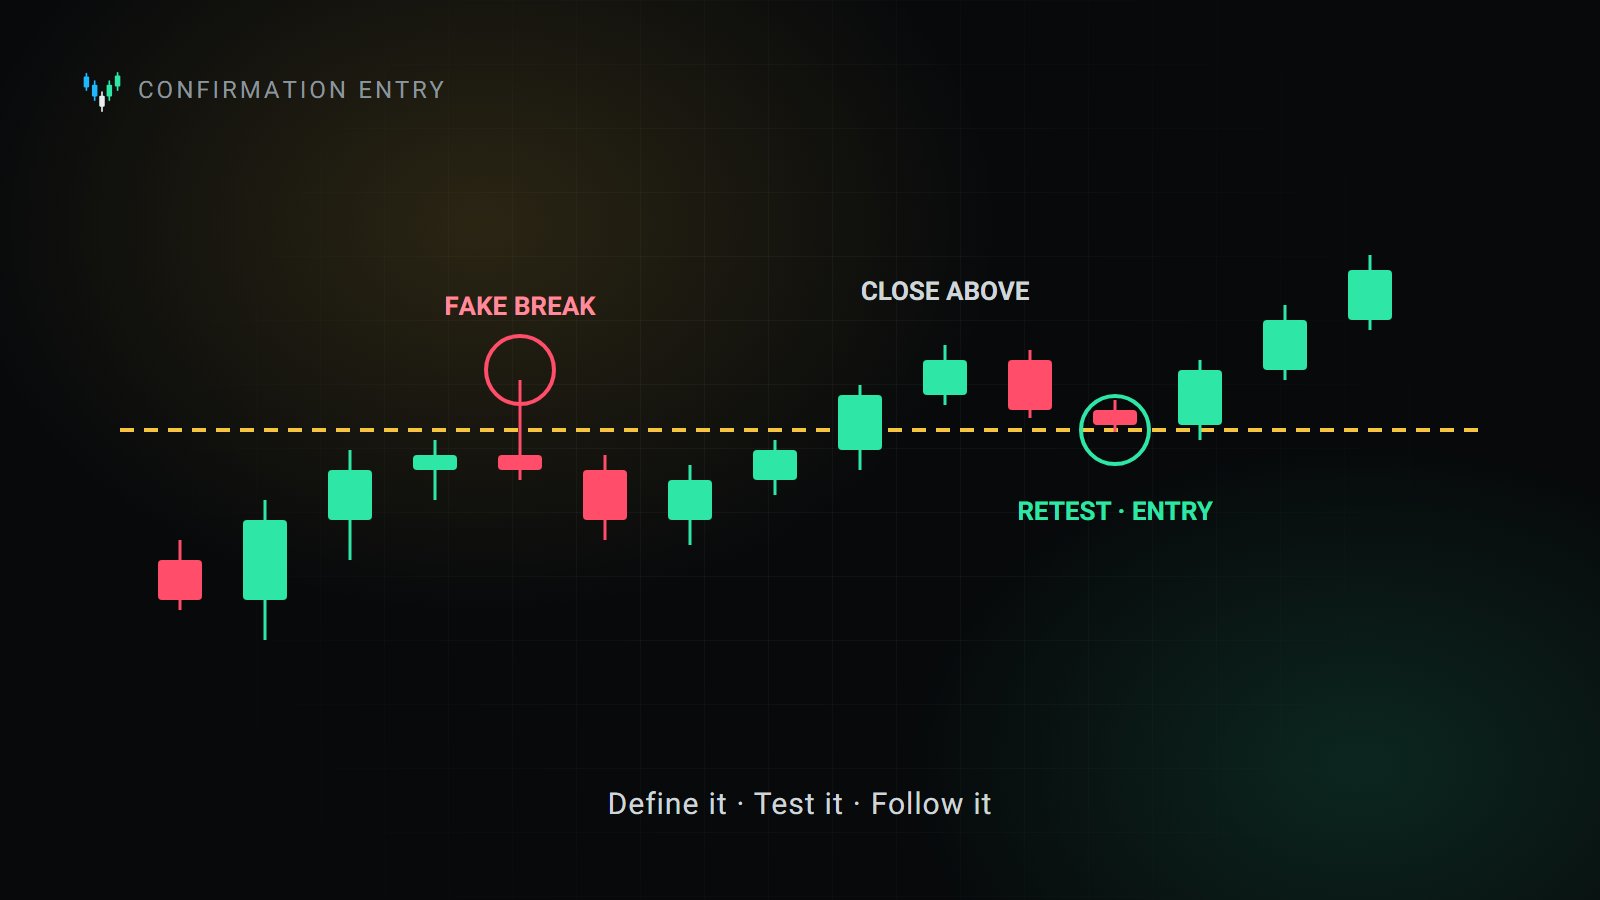
Price has reached the resistance you marked and pushed a little above it. You have two choices: buy now so you don't miss the move, or wait for the market to show the break is real. The second is a "confirmation entry", and over hundreds of trades the difference between the two adds up.
What a confirmation is
A confirmation is a condition you defined in advance and don't enter until it's met. Its purpose is to filter out some false setups, such as breaks where only a wick crosses the level and price snaps back. Common confirmations:
- A candle close: the candle on your trading timeframe closes beyond the level, not just its wick.
- A pullback or break-and-retest: after the break, price returns to the broken level and reacts from it.
- Alignment with the higher timeframe: the setup points the same way as the bigger timeframe's trend. Multi-timeframe analysis checks exactly this.
- Volume or momentum: rising volume on the break, or confirmation from an oscillator such as RSI.
- A reversal candle in the zone: in reversal setups, a clear reversal candle at support or resistance.
The price of confirmation
Confirmation isn't free. Waiting usually means a worse entry price and a wider stop, so a lower reward-to-risk. Sometimes the move runs on without a pullback and you miss it entirely. In exchange, fewer entries are false. Whether that trade-off favours you can't be judged by feel; only testing a specific rule over many trades tells you.
The trap of endless confirmations
Some traders add another confirmation after a few losses, then another. The result is that they either never enter or enter so late the move is over. One or two clear, tested confirmations beat five vague conditions. If you can't write your confirmation as one precise sentence, it isn't a confirmation; it's a mood.
Sticking to your strategy: where most traders lose
An ordinary strategy executed with discipline usually beats a great strategy that changes every day. The reason is simple: a strategy's statistics only mean something when the same rules are executed again and again. Enter once with confirmation, once without, and move the stop another time, and you no longer have statistics; you have a collection of impulse decisions.
- Write the rule down: entry, confirmation, stop, target and size, before the trade opens and on paper.
- No new decisions mid-trade: the only job during a trade is to execute what you wrote. Moving the stop "just this once" is how a system falls apart.
- Test a change, don't experiment live: if you think a rule should change, backtest it on past data first. Right after an angry loss is no time to rewrite a strategy.
- Measure execution, not profit: at the end of each week, see what share of your trades followed the rules exactly. Raise that number; profit usually follows.
- Log off-plan trades: even when they win. A rule-breaking trade that wins is the most dangerous trade of all, because it rewards a bad habit.
A simple pre-entry checklist
- Is this setup exactly one of the setups written in my strategy?
- Has the defined confirmation actually happened, or am I just hoping it will?
- Where is the stop, and how much of my account do I lose if it's hit?
- Is the higher timeframe not against this trade?
- Am I calm right now, or trying to "win back" a loss?
The bottom line
A confirmation is a tool for reducing false entries, not a guarantee of profit. Its real value shows when you define it precisely, test it, and then execute it without exceptions. A trader's edge isn't only in their analysis; it's in running the same rules on good days and bad.
This article is for education only and is not a recommendation to buy or sell any asset. Trading financial markets, especially with leverage, carries high risk.
See the tools for yourself
A live chart with market depth, dozens of indicators and drawing tools, and a Lab that turns an idea into a backtested strategy.
More articles
 Strategy & backtesting
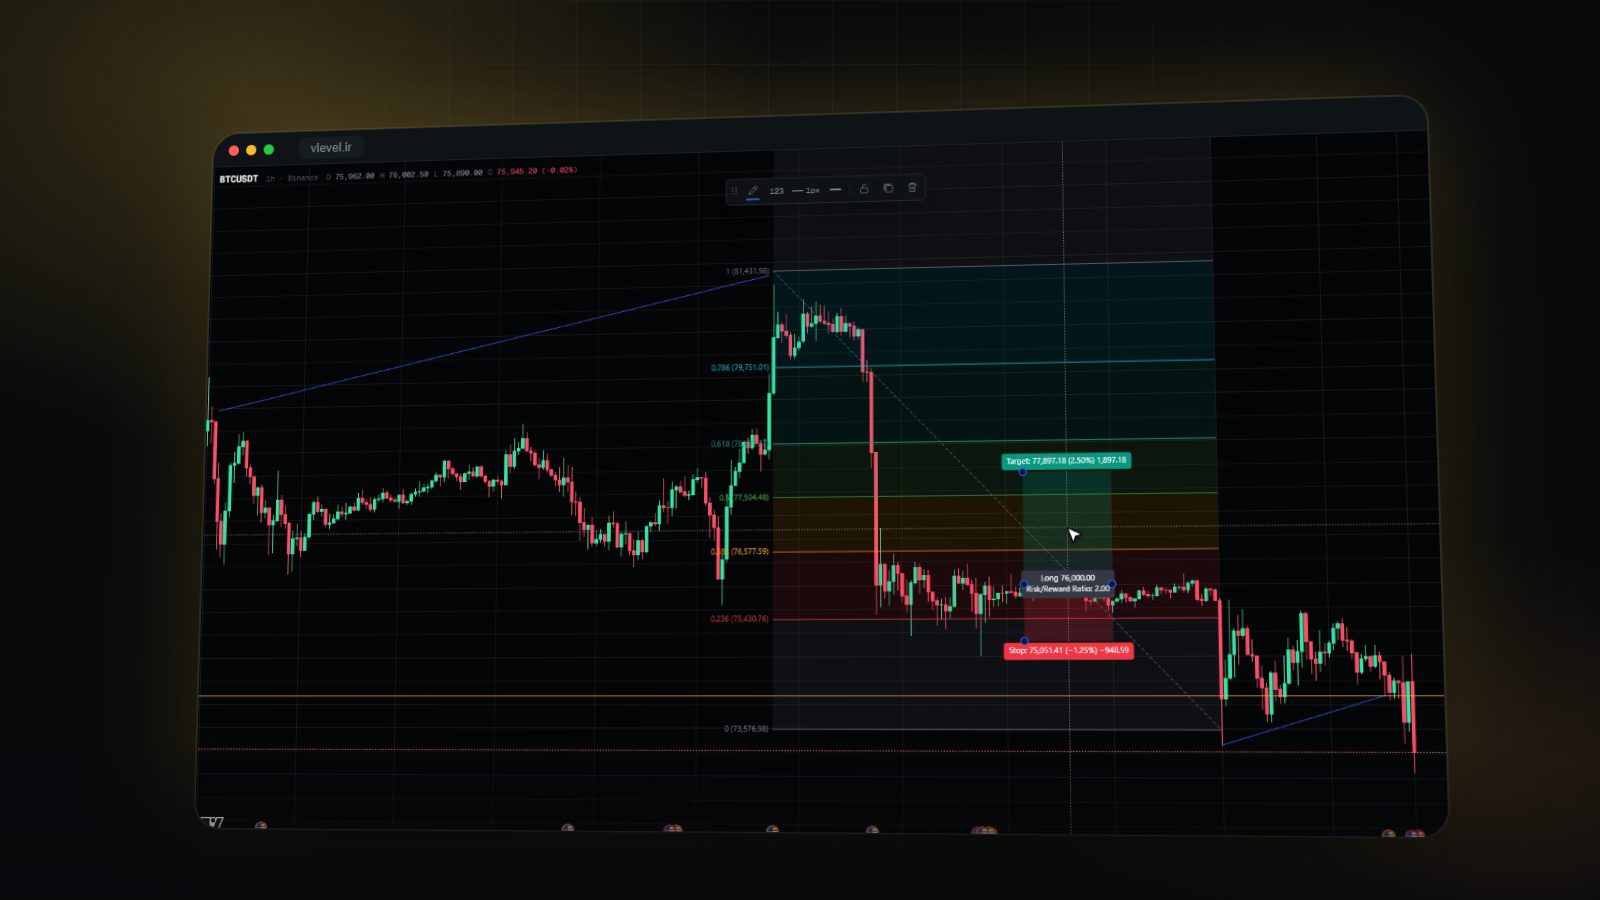
Fibonacci Retracement: How to Draw It and Which Levels Matter
Where a Fibonacci retracement starts and ends, what the 38.2, 50 and 61.8 percent levels tell you, and why no level is a reason to enter on its own.
November 10, 2026 · 2 min read
 Strategy & backtesting
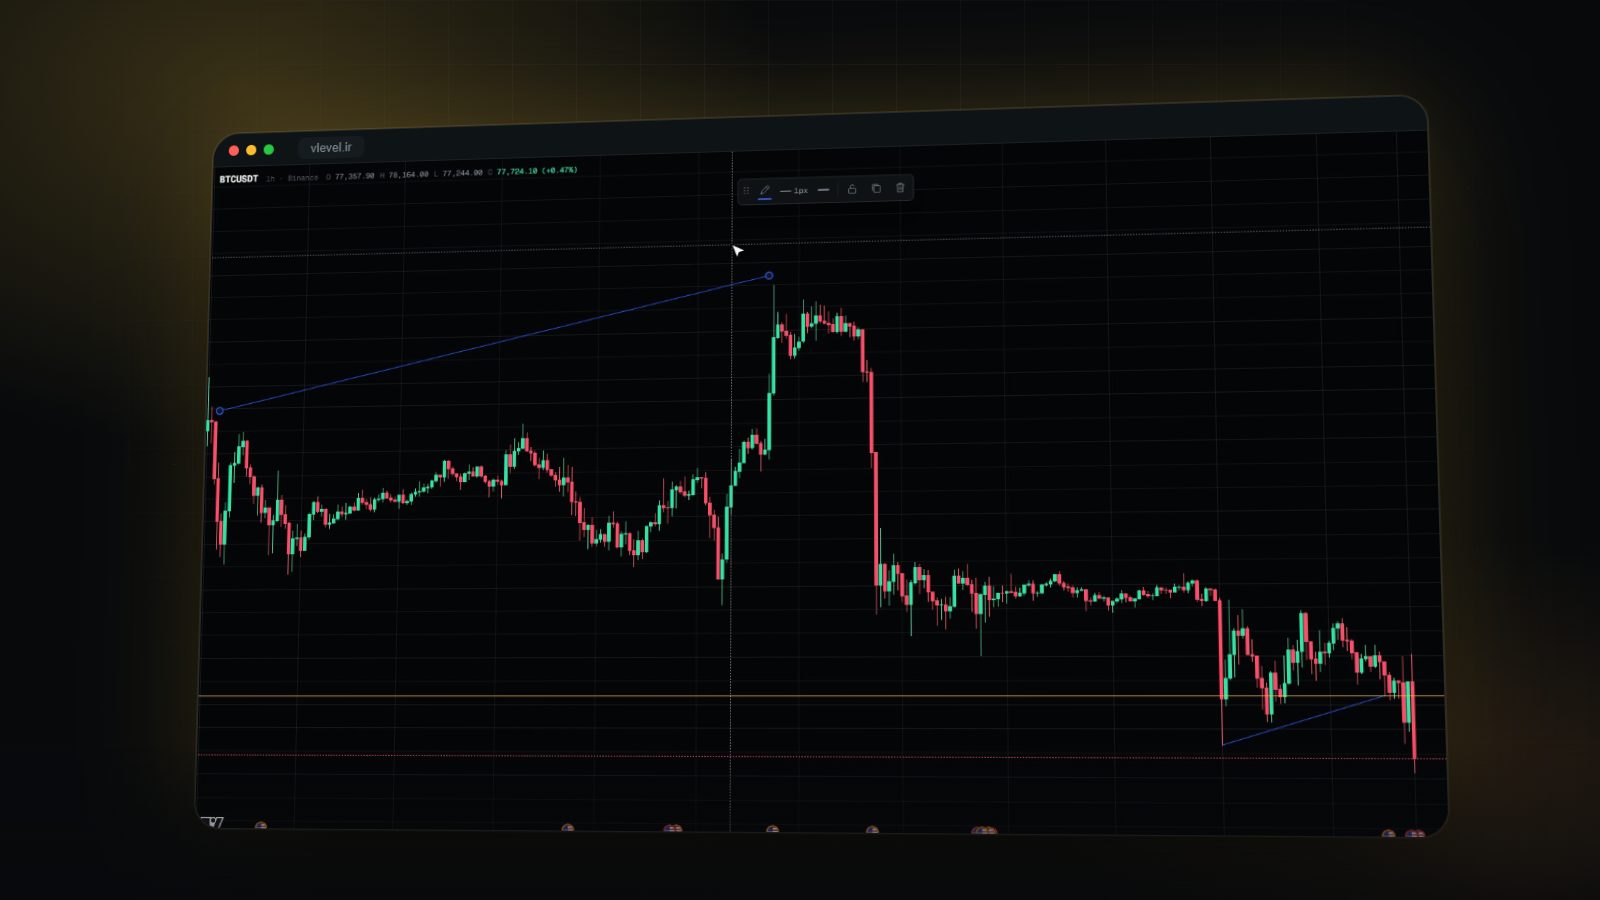
Trend Lines and Support & Resistance: Mistakes That Make Your Lines Worthless
How many touches a valid trend line needs, whether support and resistance are lines or zones, and what happens after a break. A practical guide to lines that actually help.
November 9, 2026 · 2 min read
 Strategy & backtesting
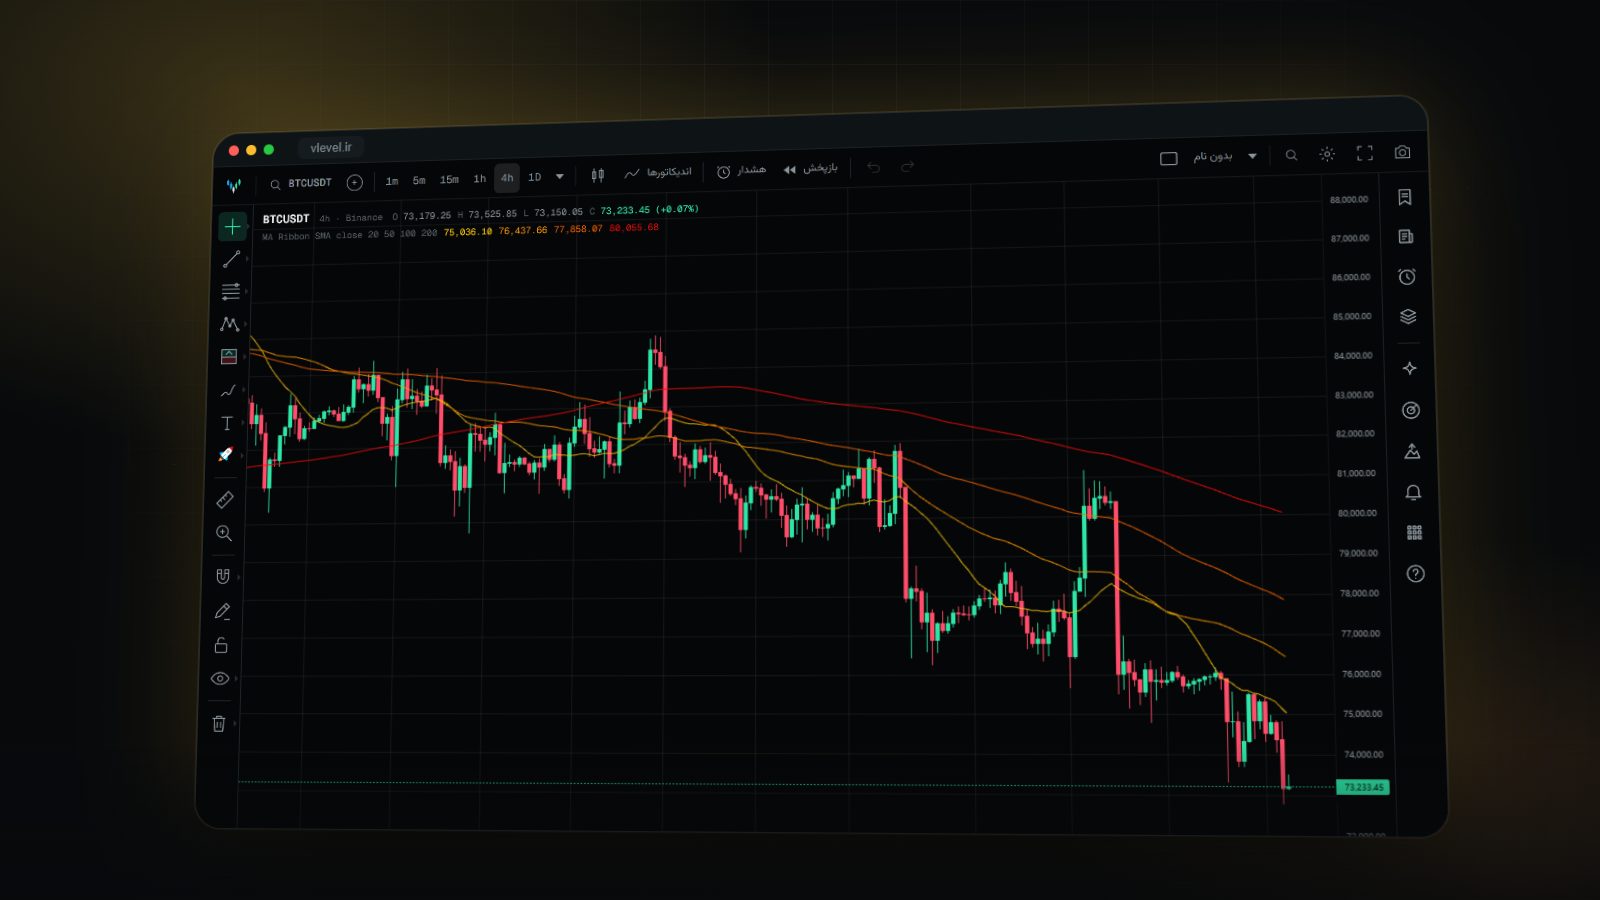
Multi-Timeframe Analysis: See the Trend From Above, the Entry From Below
Why a setup that looks perfect on the five-minute chart can be against the trend on the four-hour. The top-down method, timeframe ratios and common mistakes.
November 8, 2026 · 2 min read